You are here
Climate Variability: the Hot Cold Winter of ’16-‘17
The winter of 2016-2017 was both notable and certainly noted by many. It started early and continued well past its astronomical expiration date. The rains came, they stuck around, they were replaced by snow and then the rains took over once again. As of mid-May the rains were ongoing and flooding in the southern interior of BC has become a major concern. But, the cold and wet winter is only part of the story, one that only unfolded in southern British Columbia. The picture in northern British Columbia was the very opposite – warmth and low precipitation. All of this falls on the heels of an El Niño-fuelled and exceptionally warm 2014 and 2015 which transitioned into an ongoing warm 2016. What is going on?
These varying patterns across space and time highlight what climate scientists call natural variability. While the overall temperature of the globe is warming, there will be periods and places with cold weather. In the midst of a warming planet in which news of record high temperatures, coral bleaching, and glacier disintegration dominates, Vancouver experienced an unusually cold and snowy winter while northeast BC recorded relative warmth and dryness. This article will examine how the winter of 2016-2017 stacked up against previous winters by examining records of snowfall in the lower mainland from 1970 (a period when numerous records begin to be available) to present as well as upper atmosphere pressure data from 1979 to present. Temperatures will be put into the long-term context of records dating back to 1900. We’ll sum up by briefly describing a projection of cold days at the Vancouver International Airport and how those will change and implied reductions in snowy days.
Achieving accumulating snowfall in southern coastal British Columbia requires a very specific set of conditions because the Pacific Ocean has a strong warming influence on our weather. Most storms track in from the west having been exposed to the relative warmth of Pacific waters. These air masses are too warm to allow snow to fall. The southern coast does experience sub-freezing temperatures, but these are typically accompanied by air that travelled from polar regions and are thus very dry. The cold air cannot “hold” as much moisture. So, while cold, precipitation is lacking and snow will not fall. The recipe for snow is a storm that takes a north-to-south track along our coast. This set-up allows Pacific moisture to be drawn in from the west to mix with more polar air to the northeast, which enables the right combination of sufficient moisture and cold enough temperatures. This is somewhat rare and has to coincide with there being enough cold air over BC's interior. But even in the best circumstances for snowfall, temperatures are rarely much below zero when precipitation occurs. In a simplistic sense, this makes our snows vulnerable to a warming climate. Locations to the north and east and at higher elevations have more temperature leeway before precipitation that falls as snow today will fall as rain in coming decades.
Looking at the historical air pressure over the southwest corner of BC, we get a rough indicator of snow-generating conditions. When the air pressure is low, cold air can be drawn out of the interior, briefly over the ocean to gain moisture, and back on land. Using data1 from the European Centre for Medium Range Weather Forecasting, average air pressure from November through March was compared over the period of record from November, 1979 through March, 2017. The resulting averages show lower than normal pressure over the southwest corner of BC this past winter. Last winter had the third most extreme average low pressure over the whole period, with only the winters of ‘81/’82 and ‘98/’99 having lower readings. These were also snowy years for the south coast of British Columbia.
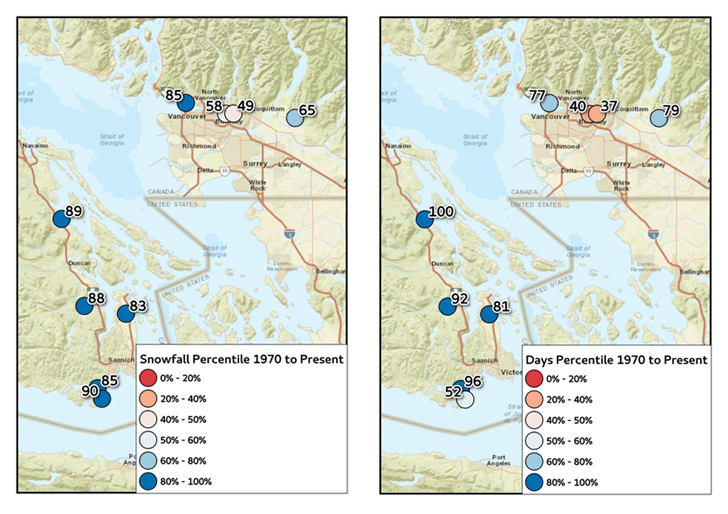
The winter of 2016/2017 brought a predominance of cold storms and relatively large amounts of snow. Using Environment and Climate Change Canada’s data, the amount of snow as well as the number of days in which snow fell over the period from November through March was compared with the historical record from 1970 onward. 1970 was chosen because from then on, there is a good regional distribution of observational stations; nevertheless, several stations have records that date back into the early 1900s. Nine stations on southeastern Vancouver Island and the Vancouver Metro area have a sufficiently long record for this analysis. The amount of daily snowfall was added up over the analysis period for each year as was the total number of days in which snow fell. The results for amount of snow are mapped in Figure 1 (left panel) and show that the low elevations of southeastern Vancouver Island had a very snowy winter, which will not be a surprise to many. Among stations spanning from Victoria to Chemainus, snow fall amounts were in the upper 17% of years meaning that, on average, roughly one in six years has a winter as snowy. Over in the Vancouver metro area, where snow repeatedly jammed traffic and caused other problems, the picture shows something closer to a normal year. Although North Vancouver experienced a year in the top 15% of snowy years, locations further to the east were closer to normal. Locations in Burnaby experienced close to normal snow amounts. And Port Moody was above normal, but only in the upper 35% of years, which equates to a year that happens every third year on average.
| Figure 1: Percentile ranking of total daily snowfall (left panel) and number of days with accumulated snow (right panel) from November, 2016 through March, 2017 at available stations in southern coastal BC. Ranking is computed over the period 1970 through 2017. High ranking occurs in years with larger snow totals (left) or in years with more snow days (right). A ranking of 100 % corresponds to record snow (left) or a record number of snow days (right). |
Perhaps there were more days of snow in the winter of 2016/2017? The number of snow days as compared with the historical record is mapped in the right panel of Figure 1. We see that on southeastern Vancouver Island this is indeed the case. Three of five stations showed a number of snowy days in the upper 8%, in fact, if we look at the full record extending back to 1919, a new record was set at Chemainus for the number of snowy days. Only William Head near Victoria had a near normal winter in terms of days with snowfall and is also the site most exposed to moderating Pacific Ocean temperatures. In the Vancouver area, the picture is less dramatic but still snowy. North Vancouver and Port Moody both exhibited days with snow in the top 23% since 1970 while stations in the Burnaby area showed less snowy weather in terms of days with accumulating snowfall.
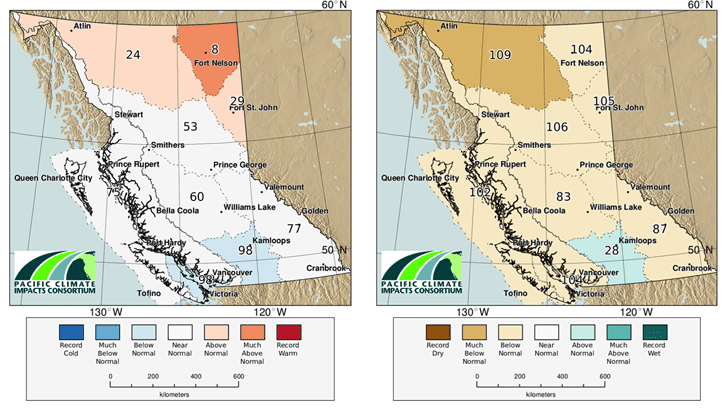
| Figure 2: Maps showing how warm or cold (left panel) and wet or dry (right panel) regions of BC were in winter 2016/2017 compared with a long-term record from 1900 through 2017. In the left panel, colors represent cooler (blues) or warmer (reds) than normal conditions for daily maximum temperature. In the right panel, colors represent wetter (greens) or drier (browns) than normal conditions for seasonal precipitation totals. Numbers indicate percentile ranking of the temperature (left panel) or precipitation amount (right panel) with large numbers indicating colder (left panel) or drier (right panel) conditions. For example, a figure of 98 on the left panel indicates that of the 118 years of record, 97 were warmer and 20 were colder and a figure of 104 on the right panel indicates that of 118 years of record, 103 were wetter and 15 were drier. |
Given the atmospheric circulation patterns that enabled snow in the region, we look to air temperatures to help explain why the winter wasn’t even more extreme in terms of snow amounts. We see (Fig. 2, left panel) that temperature was colder than the long-term average, with the region experiencing one of the top 20 coldest winters (defined as December, January and February here) since 1900, but November was one of the warmest on record and March had normal night-time temperatures and colder than normal daytime temperatures. We speculate that, given the extreme circulation patterns that this winter brought, temperatures would have been colder had climate change not played a role. We also point out that the winter was drier than normal (Fig. 2, right panel) through February although both November and March were wetter to much wetter than normal. The dry mid-winter likely helped to keep snowfall amounts lower than they might have been.
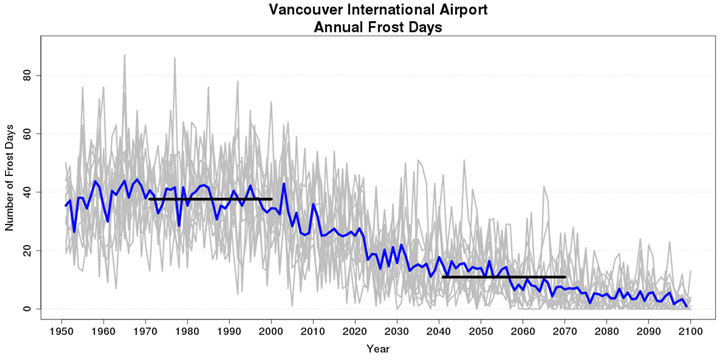
| Figure 3: Projected future number of days in which air temperature drops to or below zero centigrade at Vancouver International Airport. The projection is based on a selection of 12 representative global climate models downscaled to a 10 km resolution and then bias corrected to best match the 1971 – 2000 climate normal period. The chosen emission scenario is the extreme RCP 8.5. |
Whether climate change brings persistent changes to global weather patterns is much less well understood than the fact that temperature is rising and will continue to do so into the coming century. Weather patterns create what is called climate variability. A simple way to understand variability is to observe that, despite the gradual global rise in temperature, the earth experiences warmer and colder months and years as do continents and smaller regions. This variability will continue into the future and plays an important role in the perception of climate change. The warm winters of ‘13/’14 and ‘14/’15 are just as compatible with our present climate as this year’s cold winter is. Looking to the future, a basic way of understanding the likelihood of cold winters is to look at model projections of the total number of days at which the temperature dips below freezing in a given year (so-called "frost days"). Figure 3 shows a projection of the future occurrence of days with freezing temperatures based on a group of climate models simulating the future under the so-called "RCP 8.5" greenhouse gas emissions scenario, which roughly represents “business-as-usual” in terms of emissions increases. Under this scenario, the number of frost days will decrease by almost 75% at the Vancouver International Airport by the middle of this century. The figure also shows the variability about the average among many simulations. The variability indicates that there will continue to be cold years with numerous frost days long into the future. It also shows that there is some likelihood that the Vancouver Airport could experience a winter free of icy runways, transit lines or roads as early as the 2030s. Although this region does not experience extremely cold winters compared with much of the rest of BC, these kinds of delays are part of a normal year for this region. Furthermore, a similar near-disappearance of frost days is projected throughout much of southwestern BC.
While 2016/2017 appeared snowy where the bulk of British Columbia’s population lives, it’s important to remember that these snowfall statistics are only applicable in the lowlands around BC’s coast. Elsewhere in the northern half of the province, from roughly from Prince George northward, snow was much scarcer than normal. South of that, snowfall was near normal. In the Vancouver area, the snowy winter was likely a shock given the mild and almost snowless winters that were experienced from 2013 onward. In fact, the winters of ‘14/’15 and ‘15/’16 were the only two consecutive low snow years since 1970. But, we need only look back to 2009 for a winter in which all stations but Simon Fraser had snowfall amounts in the upper 15% with many locations both on Vancouver Island and in metro Vancouver having snow amounts in the upper 10% of years. And, of course, for Victoria the blizzard of 1996 stands out as the snowiest winter since at least 1970 over southeast Vancouver Island. The snows are gone for now, but will return even as our climate warms.
1. Berrisford, P., et al., 2011: The ERA-Interm archive Version 2.0. The European Centre for Medium Range Weather Forecasting. Report, 27 pp.


 Twitter
 Facebook
 Google
 LinkedIn